Practical Reporting is the consultancy of globally recognized instructor and best-selling author Nick Desbarats, who has trained thousands of analysts, developers, designers and other professionals in over 15 countries at organizations such as…
Learn directly from Nick live
online in January 2026!
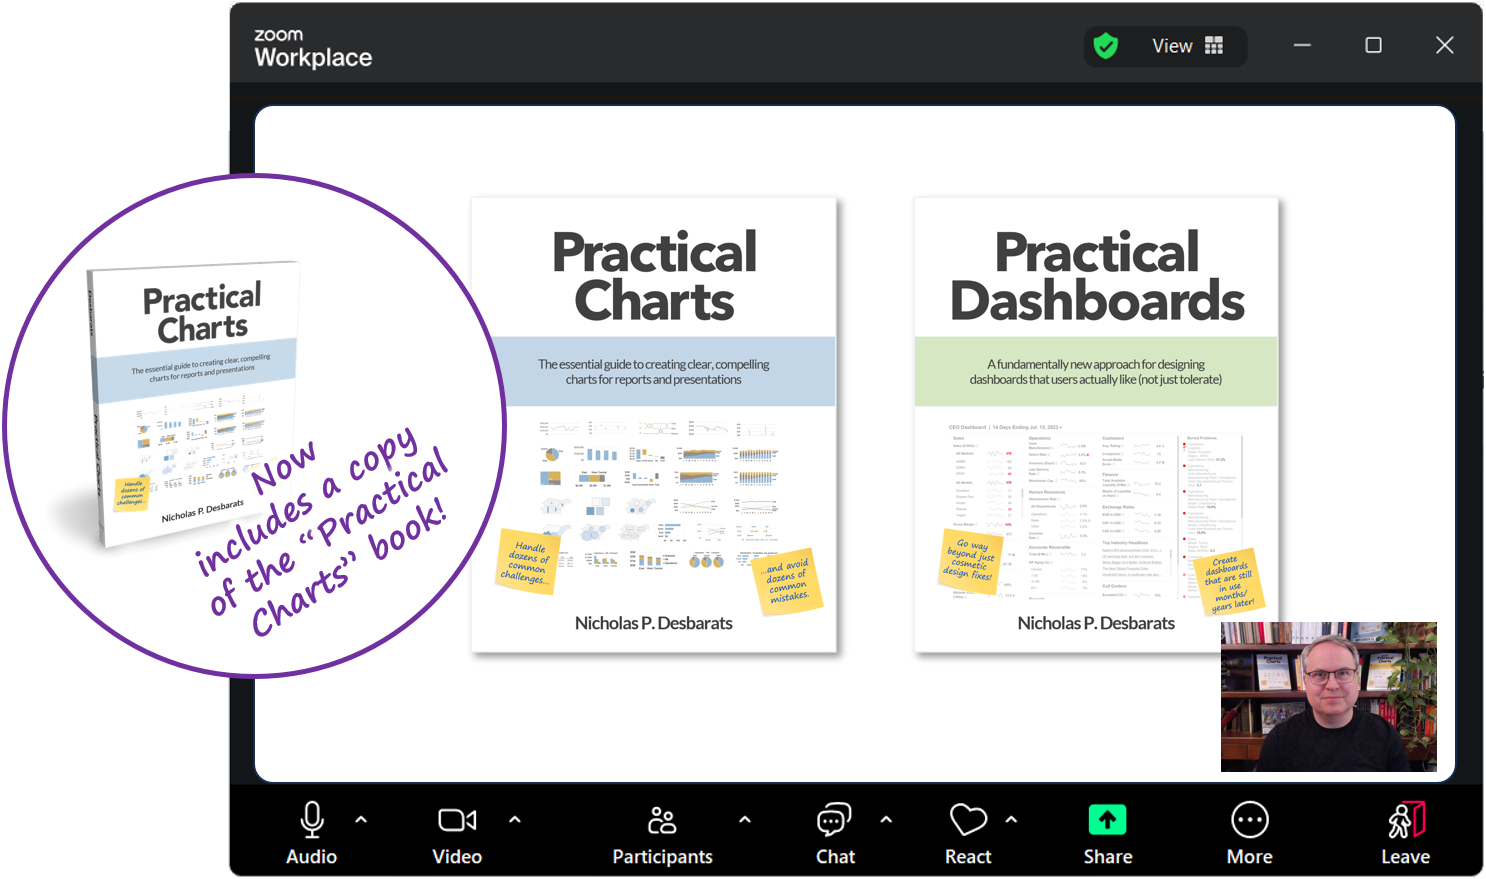
Nick will be delivering his groundbreaking Practical Charts and Practical Dashboards courses live online via Zoom in January!
Available training courses and books
Practical Charts
Nick’s revolutionary, globally recognized course and book that equips analysts, developers, designers, and anyone else who needs to communicate data to others with the principles and best practices to create charts that are professional looking, easy to read, and compelling. See the full course details.
Ways to take Practical Charts:
NEW! Practical Charts On Demand
The Practical Charts On Demand course consists of 6.5 hours of video in 45 lessons and equips you or your team with world-class data visualization skills at an affordable price and on your own schedule. Learn more.
Books
Nick’s best-selling Practical Charts and More Practical Charts books are Amazon #1 New Releases with 4.9-star ratings (as at Nov. 6, 2025) and used by Yale, Columbia and other top universities. Get bundle discounts on paperback, PDF, and eBook editions in our online store.
Live online workshops
Book a private live online workshop (four half-days) for your team of 15 or more, or…
…see the calendar of upcoming live, online, open-registration workshops for individuals.
In-person workshops
Book a private in-person workshop (two full days) for your team of 15 or more at your location, or…
…see the calendar of upcoming in-person, open-registration workshops for individuals in various cities across the globe.
Practical Dashboards
Nick’s groundbreaking course for dashboard designers and developers that uncovers the real reasons why so many dashboards fail to deliver real value, and provides actionable frameworks for creating dashboards that users actually like. Note that the Practical Charts course must be taken before taking Practical Dashboards. See the full Practical Dashboards course details.
Ways to take Practical Dashboards:
Live online workshop
Book a private live online workshop (eight half-days, including Practical Charts) for your team of 15 or more, or…
See the calendar of upcoming live, online, open-registration workshops for individuals.
In-person workshop
Book a private in-person workshop (four full days, including Practical Charts) for your team of 15 or more at your location, or…
…see the calendar of upcoming in-person, open-registration workshops for individuals or small teams in various cities across the globe.
Praise for Nick’s books and workshops
“…the best data visualization training that’s currently available…”
“Absolutely insightful, user-friendly, comprehensive, impactful, and engaging!”
“10/10 recommend for anyone who has to create charts in their lives, data worker or not.”
Recent talks and interviews
Big Data and Analytics Summit Toronto - June 2024
(registration required)
Guest lecture, Yale University - Nov. 2023


