
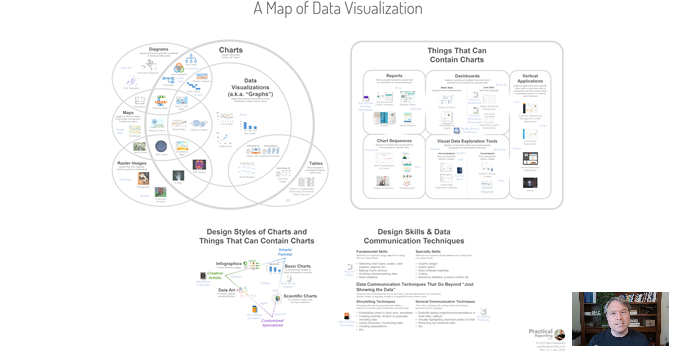
I love data visualization but, TBH, the field is a bit of a mess and can be overwhelming and unapproachable, especially for beginners. In an effort to bring a bit of order to the chaos, I've been working on a "map" that brings many dataviz-related terms, types of visuals, skills, software products and books together into a single graphic that attempts to show how they all relate to one another, and to make the field more approachable.
P.O. Box 77021, RPO Old Ottawa South
Ottawa, ON K1S 5N2
613-909-3169
Your Custom Text Here